")
")
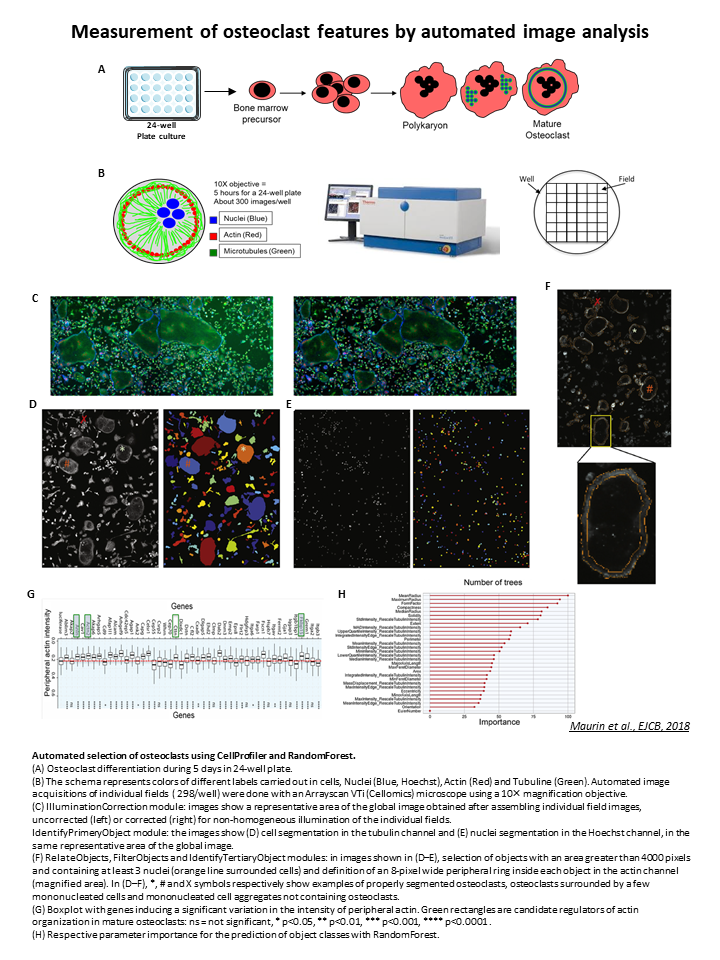
Automated and multiparametric image analysis on osteoclast cells
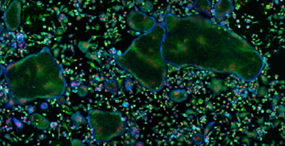
The Anne Blangy team (CRBM) wanted to perform a screening to identify genes involved in the cellular differentiation of mature osteoclasts using siRNA. For this purpose, mouse femur cells were cultured and differentiated into osteoclasts in 24-well microplates (Figure A). The ArrayScan/Cellomics was used for automated image acquisitions as shown in Figure B. The objective is to be able to segment, count, measure the size and differentiation stage of osteoclasts, in order to evaluate the effect of the tested siRNAs.
The steps of the image analysis implemented using CellProfiler and ImageJ
1. Illumination correction
Via CellProfiler, illumination correction is used to correct for illumination heterogeneity in each individual image on each of the three channels (Figures C and D). You can retrieve this pipeline from our github.
2. Merging the images to create a mosaic of the entire well
Due to the size of the osteoclasts, it is necessary to create a mosaic (global image, Figure B) in order to preserve as much as possible these large cellular structures. Volker Baecker has therefore developed an ImageJ macro to reconstruct this complete image of the well. You can retrieve this macro from our github here.
3. Object identification and parameter quantification
Made with CellProfiler, this second pipeline allows the identification/segmentation of cells and nuclei via Tubulin and Hoechst channels using the IdentifyPrimaryObjects module (Figures D and E).
The MeasureObjectSizeShape, MeasureObjectIntensity and TertiaryPrimaryObjects modules were used to select objects with an area greater than 4000 pixels², containing at least 3 nuclei and a peripheral actin corona at least 8 pixels thick, considered as mature osteoclasts (Figures D-F).
You can retrieve this second pipeline from our github.
These measurements are then exported to R to be analyzed in order to refine the identification of osteoclasts.
Object classification and validation: R software
The image analysis revealed three classes of objects: osteoclasts, osteoclasts aggregated with mononuclear cells and aggregates of poorly segmented mononuclear cells. To select only osteoclasts, a semi-supervised classification was performed with the so-called "Random Forest" technique.
For this, a manual annotation of the three classes of objects (Figures D-F: *, #, X) in a mosaic image from a "control" well was done. The Random Forest method generated a model with decision trees to select different parameters (Figure H) to predict the membership of objects to the three different classes. This model was applied to the entire screen with an accuracy of 85% and allowed for the automatic analysis of all images in the screen.
Results and analysis: R software
The effect of siRNAs on differentiation into mature osteoclasts was measured by quantification of peripheral actin. For this purpose, the Wilcoxon statistical test was used, taking as references the 7 control siRNAs of the screen. Box-plots were generated showing the effect of each siRNA tested compared to the control siRNAs (example Figure G). This allowed the identification of several candidate siRNAs (green boxes, Figure G) with a potential role on the organization of the actin cytoskeleton of mature osteoclasts.